What it does
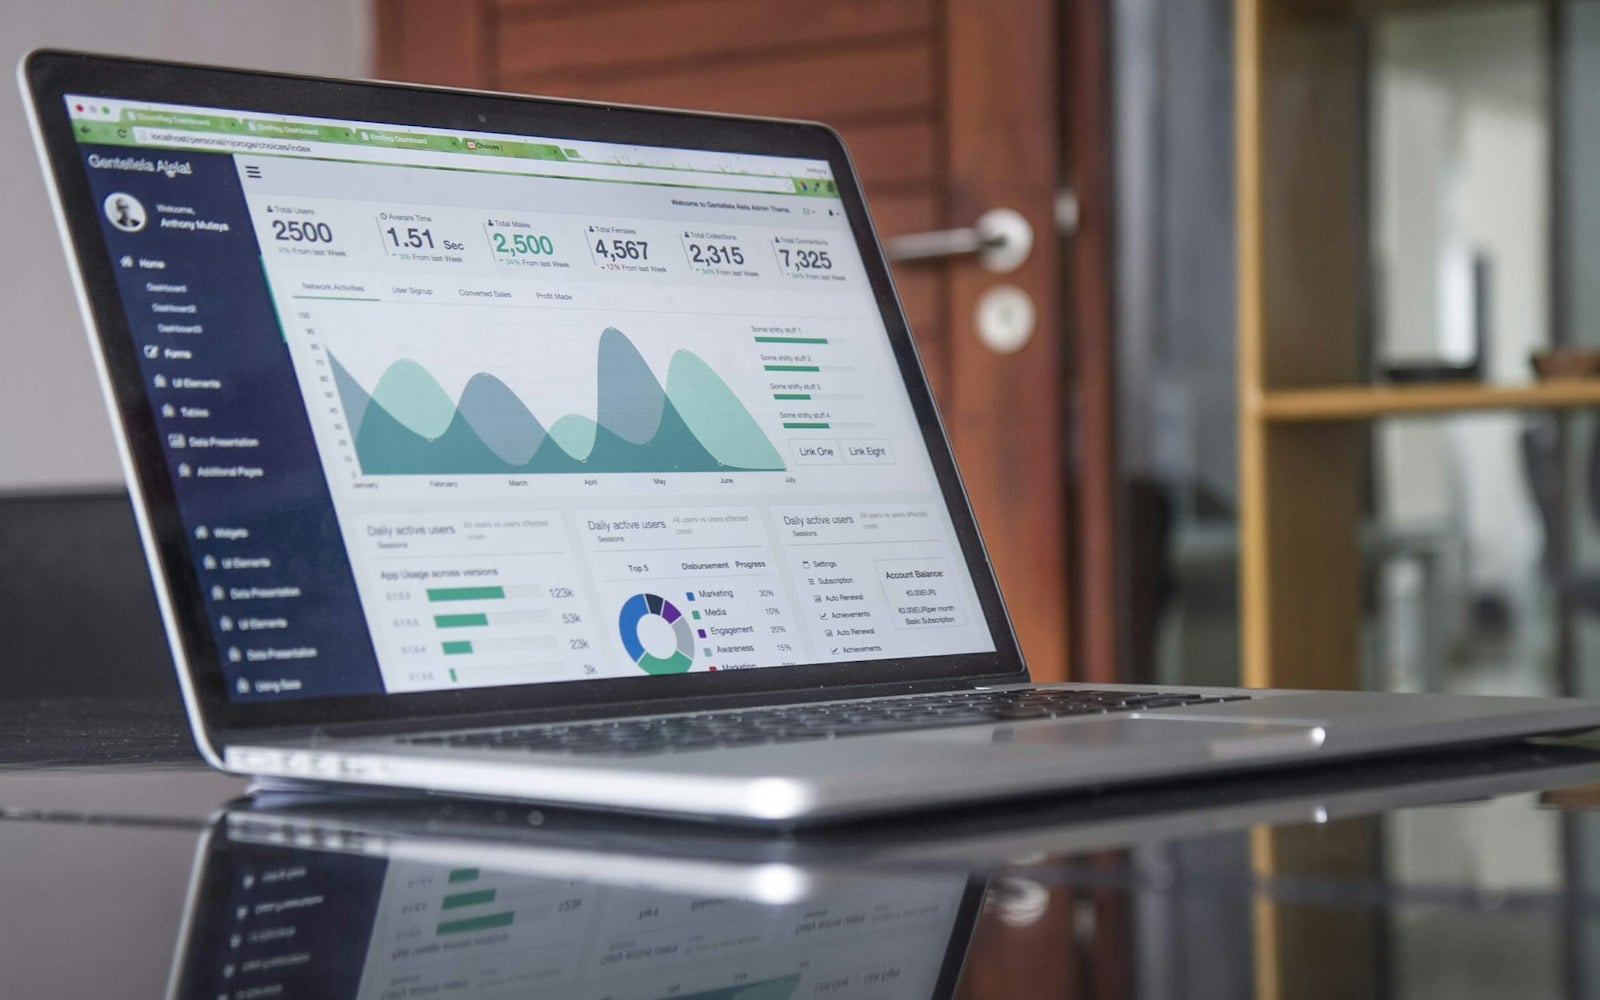
- Spending chartsChart.js charts that break spending down so patterns are easy to see.
- AccountsJWT-based sign-in, so each user sees only their own data.
- Data modelA MongoDB schema shaped around the dashboard queries.
 Next projectNotes App (MERN)