The design
- SourcesPostgreSQL (Supabase) for live user profiles, and raw web logs stored as Parquet files in S3-compatible storage (MinIO locally).
- EngineDuckDB reads both in place and acts as the semantic and transformation layer: no warehouse to load first.
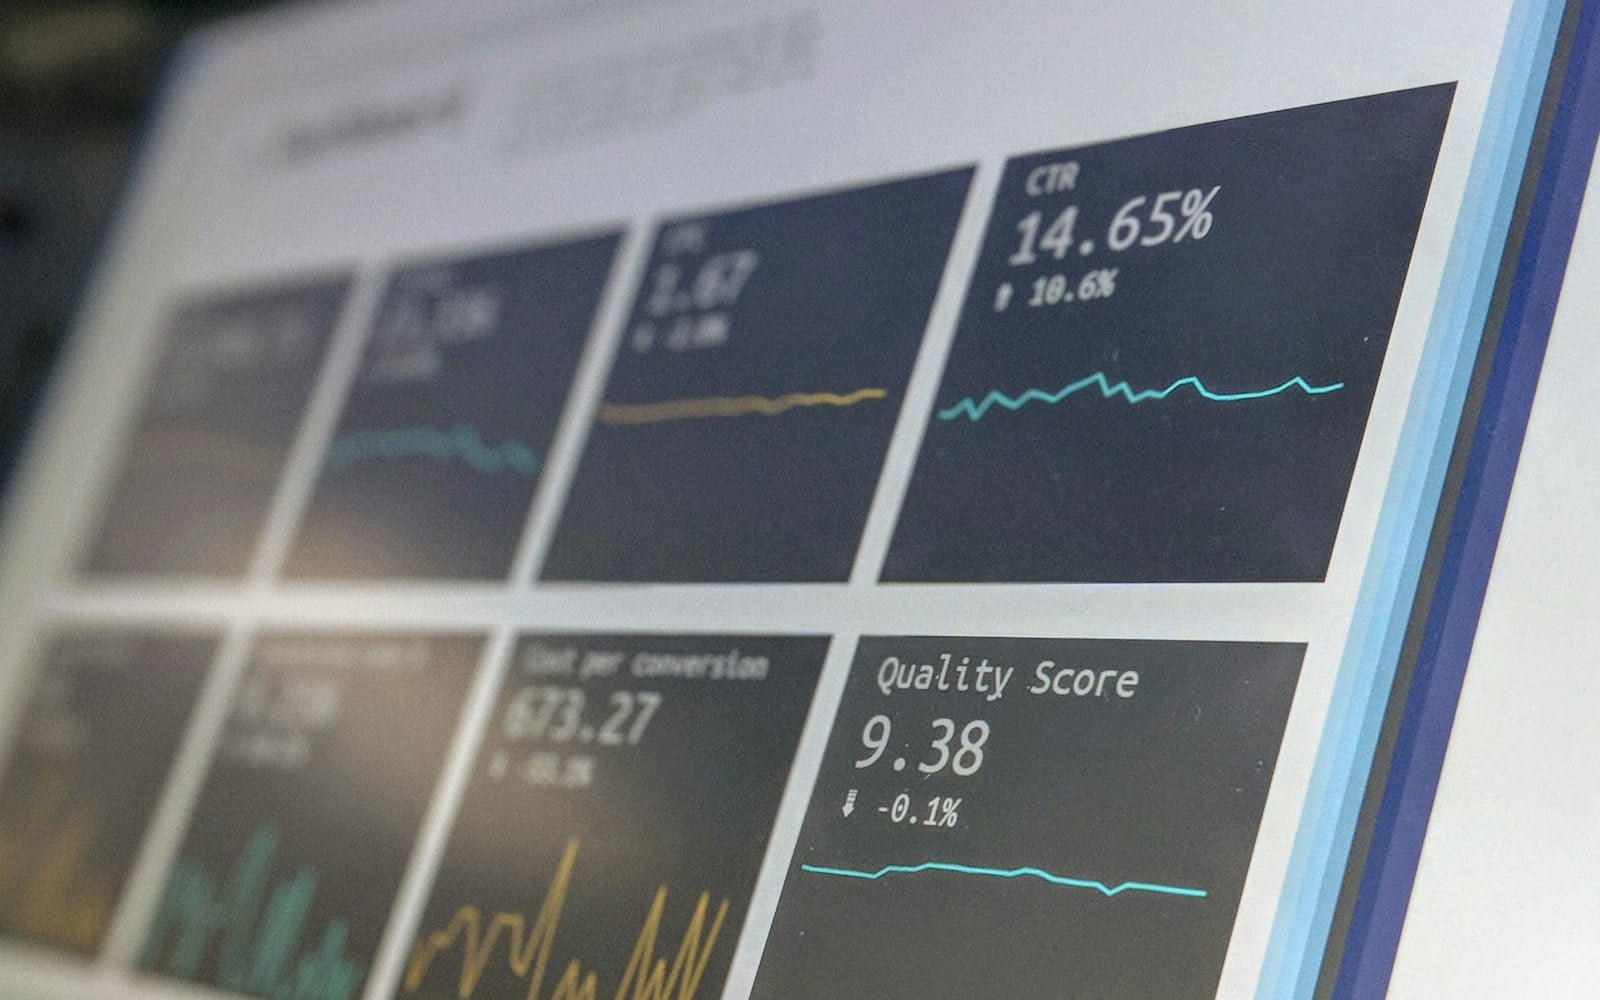
- DashboardAn interactive dashboard (Streamlit, Evidence.dev or Marimo) on top of the DuckDB models.
- WhyMoving less data means lower egress and storage costs and fresher numbers, a real pain point for data teams.
Status
- 2026Designing
Architecture and data model. The code will be public on GitHub as it is built.
 Next projectFinancial Analytics & Expense Tracker